
BNB draws extra attention both in Abu Dhabi and on the charts near a key support zone. As BNB Chain launches a Local Hack with YZi Labs, the token holds a bullish divergence just above a major demand area.
BNB Chain Kicks Off “Local Hack” in Abu Dhabi with YZi Labs
BNB Tests Demand Zone as Bullish Divergence Builds
Meanwhile, BNB continues to defend the demand zone around $900–$925 on the 4-hour chart, where buyers repeatedly step in. The price trades sideways just above this area while the descending trendline from early November still caps every bounce. This keeps the market in a short-term compression between horizontal support and falling trendline resistance.
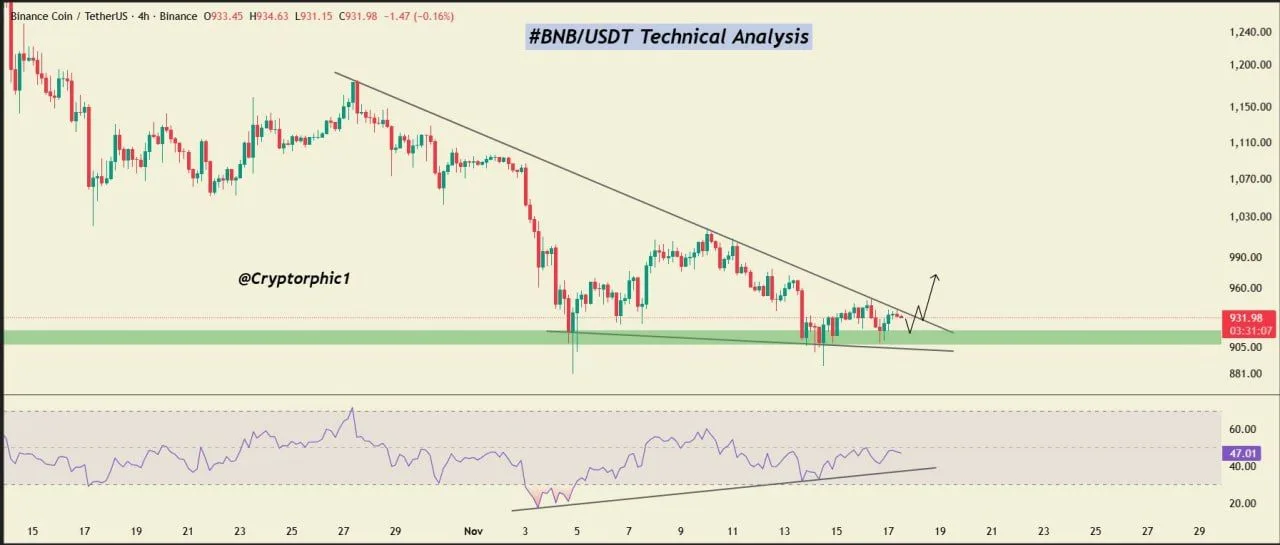
BNB Trendline Compression. Source: Cryptorphic
At the same time, the RSI forms a sequence of higher lows even as price moves flat near the floor. That structure creates a classic bullish divergence, which often signals that selling pressure is losing strength compared with previous visits to the same price band. As momentum improves under the surface, the focus shifts to whether candles can close above the trendline drawn from the recent swing highs.
If BNB breaks that line with follow-through, the chart would confirm a shift toward bullish momentum and open room for a recovery toward the prior consolidation area above the current range. However, a clean breakdown below roughly $880 would invalidate this constructive setup and show that the demand zone failed, putting lower supports back in play.
