
Bitmine’s fresh 110,288-ETH buy lands as Ethereum’s exchange balances hit new lows, undercutting Bitcoin’s share on centralized venues. At the same time, ETH/BTC stalls at long-term resistance and a bearish weekly MACD clouds the $10,000 call.
Bitmine adds 110,288 ETH, lifting holdings to 3.5 million
Bitmine Immersion Tech bought 110,288 ether for about $384 million, according to a post from Crypto Patel citing the company’s account on X. The purchase brings Bitmine’s reported reserve to 3.5 million ETH valued at roughly $12.21 billion.
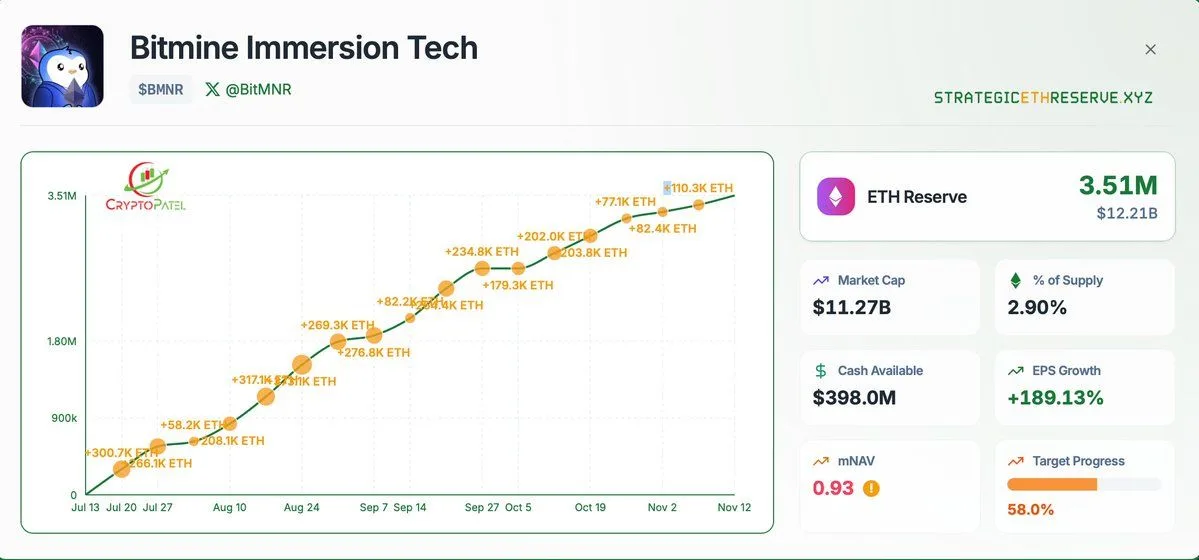
Bitmine Immersion Tech ETH Reserve. Source: CryptoPatel on X
The holding equals about 2.9% of Ethereum’s circulating supply, the post said. It also described the buy as one of the largest recent institutional ether acquisitions. Bitmine’s handle, @BitMNR, and a dashboard labeled Strategic ETH Reserve showed the cumulative total reaching 3.51 million ETH.
The post highlighted the accumulation as a sign of continued institutional confidence in Ethereum’s long-term value.
Ethereum supply on exchanges hits record low as ETH/BTC faces rejection
Meanwhile, Ethereum’s supply on centralized exchanges has dropped below Bitcoin’s for the first time, according to Glassnode data shared by CryptoGoos. The chart shows ETH’s exchange balance falling under 10%, marking a new multi-year low. Analysts view this decline as a sign of long-term accumulation, as fewer coins remain available for immediate sale.
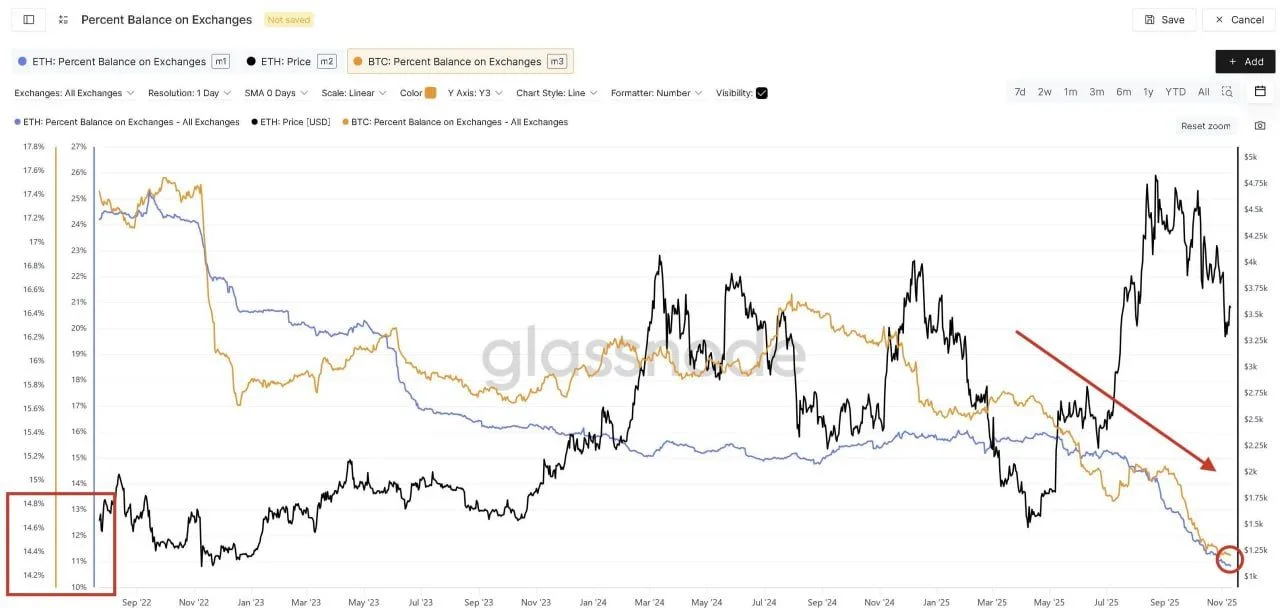
Ethereum vs Bitcoin exchange balances. Source: Glassnode via CryptoGoos on X
Bitcoin’s exchange balance, shown in orange, still sits higher at around 11%, highlighting Ethereum’s sharper outflow trend. This shift coincides with large institutional purchases, including Bitmine Immersion Tech’s recent addition of over 110,000 ETH. Together, these movements indicate growing on-chain scarcity that could affect future price dynamics.
At the same time, Ethereum’s ratio against Bitcoin continues to struggle. A chart shared by Borg shows ETH/BTC repeatedly rejected from a long-term descending resistance line stretching back to 2021. Each attempt to break above that trendline has failed, suggesting persistent relative weakness despite Ethereum’s declining exchange supply.
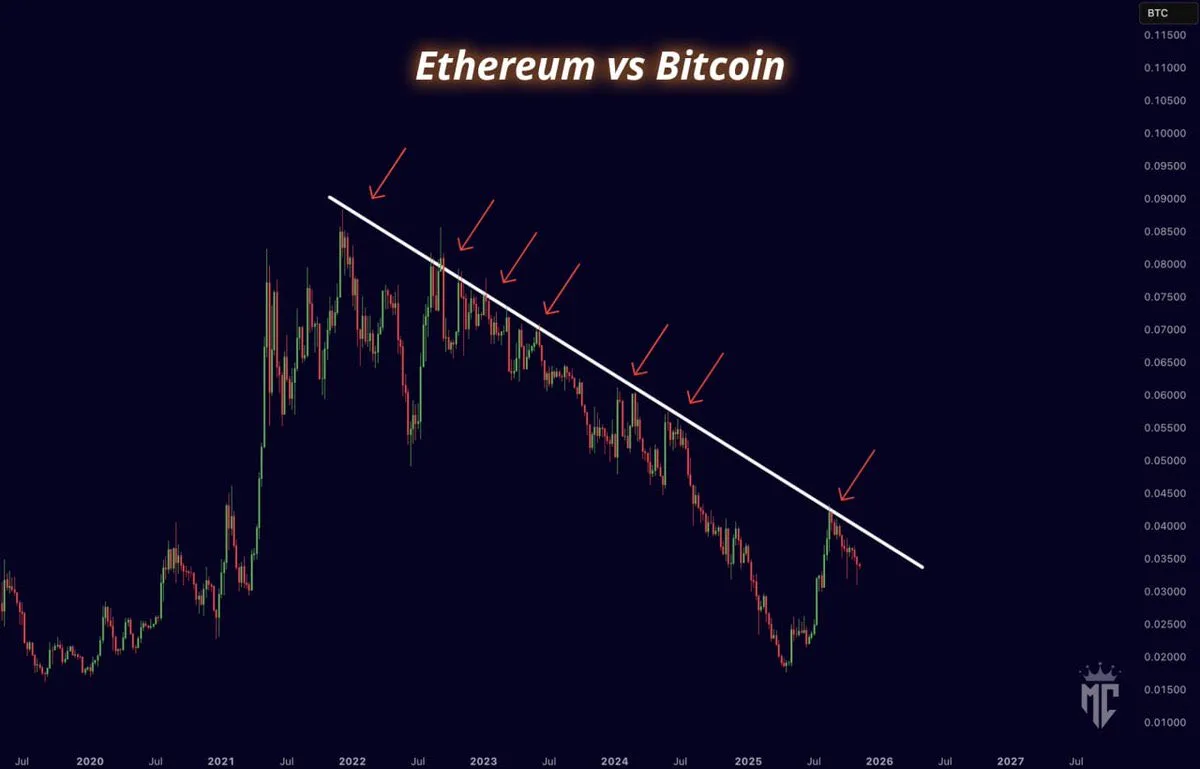
Ethereum vs Bitcoin trendline rejection. Source: Borg on X
If ETH maintains scarcity while sentiment improves, analysts suggest that the next successful breakout above this resistance could shift the ETH/BTC structure in favor of Ethereum. For now, however, data points to accumulation beneath the surface and technical resistance capping relative gains.
Analyst questions $10,000 Ethereum target as momentum weakens
Crypto analyst Ali shared a weekly Ethereum chart showing declining momentum indicators and fading strength, questioning whether ETH could realistically reach $10,000 by December. The chart, posted on X, displays the ETH/USDT pair on Binance, where price trades near $3,166 after struggling to sustain higher levels above $4,000.
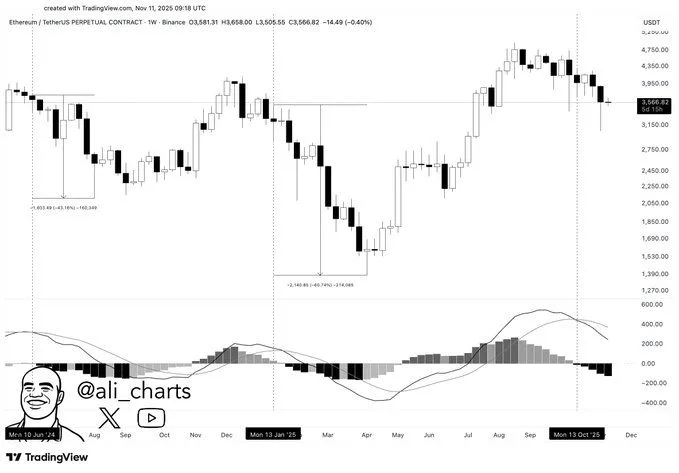
Ethereum Weekly MACD Setup. Source: @ali_charts on X
The analysis highlights a loss of upward momentum on the Moving Average Convergence Divergence (MACD) indicator, which recently flipped bearish. This crossover suggests weakening trend strength following a multi-month rally earlier in 2025. The histogram also shows decreasing positive bars, indicating reduced buying pressure.
Ethereum has retraced from its September highs, forming lower weekly closes over recent sessions. Technical traders now watch whether the current support near $3,000 will hold. A failure to maintain that level could confirm a broader correction phase, delaying any move toward the $10,000 mark.
