
Shiba Inu has narrowly avoided a major psychological setback after rebounding from a sharp decline that briefly added a fifth zero to its price. The token’s ability to recover above the $0.00001 mark has brought temporary relief to investors, even as selling pressure and bearish technical signals continue to weigh on its outlook.
Shiba Inu’s Swift Rebound After Sharp Drop
October began with optimism for Shiba Inu and the wider crypto market, as several assets rallied strongly in what traders called “Uptober.” The upward momentum fueled hopes for a sustained market recovery. However, those expectations faded quickly following the renewed trade tensions between China and the United States on October 10.
The escalating trade war triggered a widespread sell-off across digital assets, dragging Shiba Inu from around $0.000012 to $0.000007448. That drop temporarily added a fifth zero to its price for the first time in over a year. The meme-based cryptocurrency quickly erased that loss, surging to a daily high of $0.00001072 on October 11.
Since then, Shiba Inu has managed to hover near the $0.00001 threshold, occasionally slipping below it but rebounding soon after. This resilience has given the Shiba Inu community a sense of psychological victory, viewing the token’s ability to maintain four zeros as a sign of underlying strength despite persistent market uncertainty.
On October 21, the token staged another recovery, rising from about $0.000009876 to $0.00001055. At the time of writing, the token trades at around $0.00001003, up 1.54% in the last 24 hours. Still, its current price remains far below the December high of $0.00003329, a decline of nearly 70%.
Exchange Activity and Bearish Technical Signals
While the price has shown resilience, growing caution among investors. Between October 20 and 22, Shiba Inu’s exchange reserves increased from 82.09 trillion to 82.14 trillion SHIB, according to market data. This uptick signals that more holders are moving tokens to exchanges, often a sign of potential selling intent.
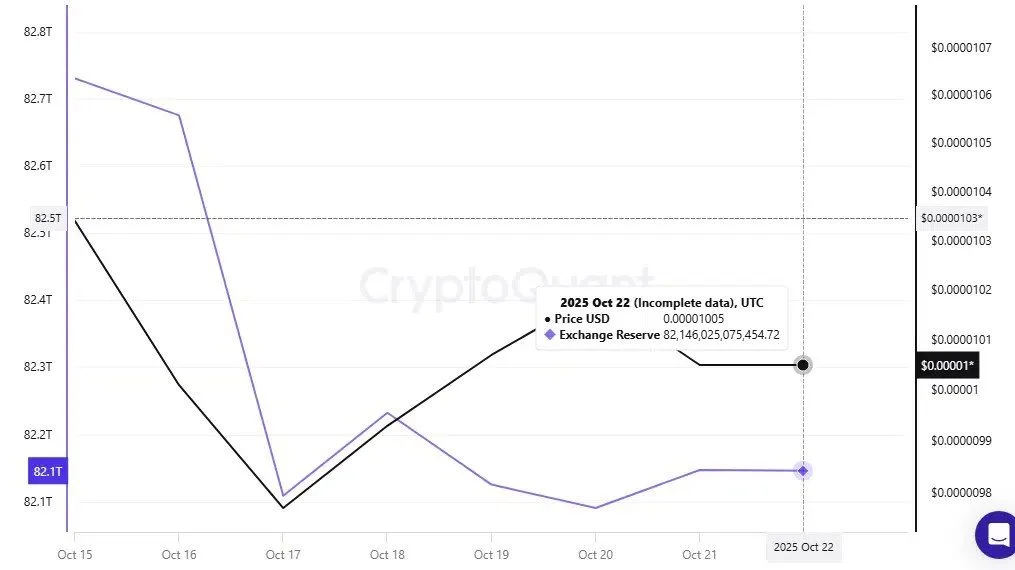
Source: SHIB Exchange Reserve
A descending triangle has been identified, and a pattern is forming on Shiba Inu’s chart. This structure typically signals bearish continuation and potential downside movement. The triangle’s base, positioned around $0.00001052, has been tested several times since April.
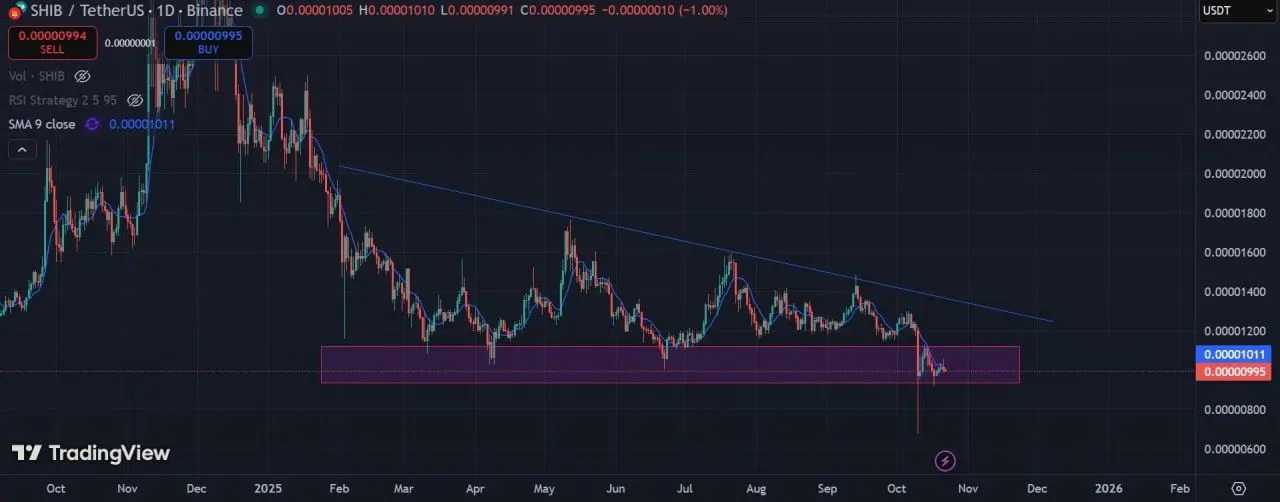
Shiba Inu 1-day price chart, Source: TradingView
If that support level fails, the token could drop as low as $0.000006. Such a move would erase recent gains and potentially reintroduce the fifth zero that traders fear.
Despite the risks, Shiba Inu continues to show resilience in the short term. Its ability to maintain stability above the $0.00001 mark remains a positive psychological marker for its community. However, the combination of increasing exchange reserves and bearish technical signals indicates that the token’s recovery may be fragile.
